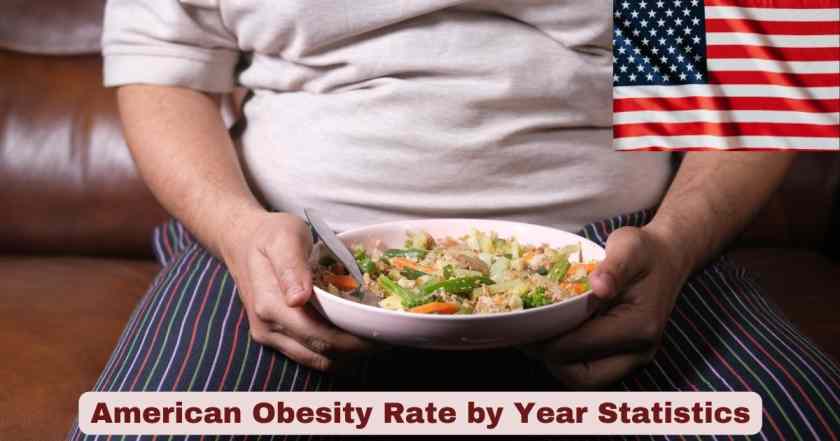
Obesity Rate by Year in America 2026
The obesity rate by year in the US has been one of the most closely tracked public health metrics for over two decades — and as of 2026, the picture is both alarming and, for the first time in years, cautiously noting the first small signs of stabilization. The most current measured data comes from the National Health and Nutrition Examination Survey (NHANES) covering August 2021 through August 2023, published by the CDC’s National Center for Health Statistics in September 2024, which recorded a national adult obesity prevalence of 40.3%. That figure sits above the Healthy People 2030 target of 36.0%, meaning more than 100 million US adults are currently living with obesity. The latest 2024 state-level BRFSS data, released by the CDC on December 3, 2025, adds the most current geographic layer to the story and confirms that every single US state and territory reports an adult obesity prevalence of at least 25% — meaning at least 1 in 4 adults everywhere in this country has obesity right now.
What makes the 2026 data landscape meaningful is that 19 states had adult obesity rates at or above 35% in 2024 — down from 23 states in 2023 — marking the first-ever recorded decrease in the number of states at that threshold since this BRFSS dataset began in 2011. Simultaneously, the NCHS Health E-Stat No. 112, published in February 2025, confirmed that 21.1% of US children and adolescents ages 2–19 had obesity during the most recent NHANES cycle, up from 19.7% in 2017–March 2020, signaling that whatever stabilization is appearing in adults has not yet reached the youngest Americans. Every data point in this article is drawn exclusively from verified US government sources — the CDC, NCHS, and BRFSS — and reflects the most current published figures available as of March 2026. No projections, estimates, or non-governmental sources are used anywhere in this article.
Key Obesity Facts in the US 2026 – Fastest-Growing Public Health Crisis Statistics
Before breaking the data down section by section, the table below consolidates the most important verified, government-sourced fast facts in one place. These are the numbers every reader needs to understand first.
| Fact | Latest Verified Data Point |
|---|---|
| Adult obesity prevalence — NHANES Aug 2021–Aug 2023 | 40.3% |
| Adult severe obesity prevalence — NHANES (age-adjusted) | 9.7% |
| Estimated US adults with obesity | More than 100 million |
| Estimated US adults with severe obesity | More than 22 million |
| Child/adolescent obesity rate — NHANES Aug 2021–Aug 2023 | 21.1% |
| Child/adolescent severe obesity — NHANES Aug 2021–Aug 2023 | 7.0% |
| Estimated US children ages 2–19 with obesity | ~14.7 million |
| Annual US medical costs from adult obesity | $173 billion (in 2019 dollars) |
| Excess annual medical cost per adult with obesity | $1,861 more per year vs. healthy weight |
| Annual medical cost of childhood obesity | $1.3 billion (in 2019 dollars) |
| States with obesity ≥ 35% in 2024 (BRFSS) | 19 states |
| States with obesity ≥ 35% in 2023 (BRFSS) | 23 states |
| States with obesity ≥ 35% before 2013 | 0 states |
| Highest state obesity rate 2024 | West Virginia — 41.4% |
| 2nd highest state 2024 | Mississippi — 40.4% |
| 3rd highest state 2024 | Louisiana — 39.2% |
| Lowest state obesity rate 2024 | Colorado — 25.0% |
| Midwest obesity rate 2024 (BRFSS) | 35.9% |
| South obesity rate 2024 (BRFSS) | 34.5% |
| Adults with obesity who also have high blood pressure | 58% |
| Adults with obesity who also have diabetes | ~23% |
| College graduates with obesity (BRFSS 2024) | 27.3% |
| Adults without college degree with obesity (BRFSS 2024) | 35.4–37.6% |
Data Sources: CDC NCHS Data Brief No. 508, September 2024; CDC 2024 Adult Obesity Prevalence Maps (BRFSS), December 3, 2025; CDC Adult Obesity Facts; CDC Childhood Obesity Facts; NCHS Health E-Stat No. 112, February 2025
The sheer scale embedded in the table above demands real attention from anyone reading it. More than 100 million US adults living with obesity is a figure that exceeds the total population of most countries on earth. When you add the $173 billion in annual medical costs tied directly to obesity — calculated in 2019 dollars, meaning the real inflation-adjusted 2025 burden is considerably higher — the crisis extends far beyond individual health into the financial stability of the entire US healthcare system. The comorbidity burden is what amplifies these costs so dramatically: 58% of adults with obesity also have high blood pressure, and ~23% also have diabetes — two of the costliest chronic conditions in medicine, each carrying its own cascade of downstream complications. The fact that before 2013, not a single US state had an adult obesity prevalence at or above 35%, and today 19 states are at or above that level, captures in one comparison just how far and how fast this epidemic has progressed.
Obesity Rate by Year in the US 2026 – Complete NHANES Historical Trend 1999–2023
The table below represents the most authoritative year-by-year record of the US adult obesity rate — built entirely from NHANES measured data, not self-reported figures, making it the gold standard for tracking this epidemic over time.
| NHANES Survey Period | Adult Obesity Prevalence (Age-Adjusted) | Severe Obesity Prevalence |
|---|---|---|
| 1999–2000 | 30.5% | 4.7% |
| 2001–2002 | 30.4% | 5.1% |
| 2003–2004 | 32.1% | 4.8% |
| 2005–2006 | 34.3% | 5.9% |
| 2007–2008 | 33.8% | 5.7% |
| 2009–2010 | 35.7% | 6.3% |
| 2011–2012 | 34.9% | 6.4% |
| 2013–2014 | 37.7% | 7.7% |
| 2015–2016 | 39.6% | 7.8% |
| 2017–March 2020 | 41.9% | 9.2% |
| August 2021–August 2023 | 40.3% | 9.7% (age-adjusted) |
Data Sources: CDC NCHS Data Brief No. 508, September 2024; CDC Adult Obesity Facts (updated 2025); CDC NCHS Health E-Stat series, 1999–2023
Reading the obesity rate by year table from top to bottom is reading the story of one of the most dramatic chronic disease escalations in American history. From 30.5% in 1999–2000 to 40.3% in August 2021–August 2023, the age-adjusted adult obesity rate climbed by nearly 10 full percentage points — a 32% relative increase in just over two decades. Critically, this was not a smooth upward climb: rates hovered around 33–35% between 2007 and 2012, then accelerated sharply from 37.7% in 2013–2014 to 41.9% in 2017–March 2020 — a near 4.2 percentage point spike in roughly six years, the steepest multi-year acceleration in the entire NHANES record. The severe obesity track is even more alarming on a relative basis: starting at 4.7% in 1999–2000 and reaching 9.7% by 2021–2023, it has essentially doubled in 24 years, with the most rapid growth occurring after 2013.
The most recent figure of 40.3% for August 2021–August 2023 is technically 1.6 percentage points lower than the 41.9% for 2017–March 2020 — the first time consecutive NHANES cycles have shown a decline. However, the CDC and NCHS have been explicit: this difference is not statistically significant and does not constitute evidence of a genuine downward trend. The Healthy People 2030 goal is 36.0% — and as of the most recent data, the US is 4.3 percentage points above that target. NHANES is currently collecting data for the 2023–2025 cycle, and those results will be the most important single data point in determining whether any true plateau has occurred, or whether the 2021–2023 dip is a pandemic-era measurement artifact.
Adult Obesity Rate by Age Group in the US 2026 – Age-Specific Prevalence Statistics 2021–2023
Age is one of the strongest and most consistent predictors of obesity risk in the US adult population. Every figure below is taken directly from NCHS Data Brief No. 508, published September 2024.
| Age Group | Obesity Prevalence | Severe Obesity Prevalence |
|---|---|---|
| Adults ages 20–39 | 35.5% | 9.5% |
| Adults ages 40–59 | 46.4% | 12.0% |
| Adults ages 60 and older | 38.9% | 6.6% |
| All adults 20+ (age-adjusted combined) | 40.3% | 9.7% |
| Men ages 20+ (age-adjusted) | 39.3% | 6.7% |
| Women ages 20+ (age-adjusted) | 41.4% | 12.1% |
| Middle-aged vs. younger adults — relative likelihood of obesity (BRFSS 2024) | ~30% more likely | — |
| Middle-aged vs. older adults — relative likelihood of obesity (BRFSS 2024) | ~25% more likely | — |
Data Sources: CDC NCHS Data Brief No. 508, September 2024; CDC 2024 Adult Obesity Prevalence Maps (BRFSS), December 3, 2025
The ages 40–59 group carries the heaviest obesity burden at 46.4% — nearly 11 percentage points higher than adults in their 20s and 30s, and 7.5 percentage points higher than adults aged 60 and older. The 2024 BRFSS data published December 3, 2025 quantifies this gap even more sharply: middle-aged adults are about 30% more likely to have obesity than younger adults, and about 25% more likely than older adults. This is the age window where cumulative dietary patterns, declining physical activity, metabolic change, and career-related stress converge. The severe obesity figure for ages 40–59 at 12.0% means approximately 1 in 8 Americans in their 40s and 50s already has a BMI of 40 or higher — the level associated with the most serious health complications, the highest medical costs, and the most complex treatment needs.
The gender split tells a particularly important story for severe obesity: women carry nearly double the severe obesity rate of men — 12.1% vs. 6.7% — a gap that holds across every age group in the NHANES data and is statistically significant across all subgroups measured in NCHS Data Brief No. 508. For the ages 60 and older group, the lower severe obesity prevalence of 6.6% likely reflects in part a survivor effect — people with extreme obesity-related disease burden often do not reach older age — rather than protection provided by aging itself. This means the 60+ group’s comparatively better numbers mask the full mortality cost of severe obesity decades earlier.
Obesity Rate by Race and Ethnicity in the US 2026 – Racial Disparity Statistics 2022–2024 BRFSS
The 2022–2024 combined BRFSS data, released by the CDC on December 3, 2025, is the most current available breakdown of US adult obesity by race and ethnicity.
| Race / Ethnicity | Number of States/Areas with Obesity ≥ 35% | Data Coverage |
|---|---|---|
| Non-Hispanic Black adults | 41 states/areas | 47 states, 1 territory, DC |
| Non-Hispanic American Indian or Alaska Native adults | 36 states | 46 states |
| Hispanic adults | 33 states/areas | 47 states, 3 territories, DC |
| Non-Hispanic White adults | 17 states/areas | 47 states, 2 territories, DC |
| Non-Hispanic Asian adults | 0 states/areas | 39 states, 1 territory, DC |
Data Source: CDC 2024 Adult Obesity Prevalence Maps — Race/Ethnicity Breakdown (2022–2024 combined BRFSS), Released December 3, 2025
The racial disparity in the latest 2022–2024 BRFSS race/ethnicity data is stark by any measure. Non-Hispanic Black adults have an obesity prevalence at or above 35% in 41 out of 47 states with sufficient data — meaning in nearly every measurable state, Black adults are already in the highest obesity tier. American Indian and Alaska Native adults register at or above 35% in 36 states, and Hispanic adults reach that threshold in 33 states. By total contrast, non-Hispanic Asian adults do not reach the 35% threshold in a single state or territory out of 39 measured geographic areas. This does not mean Asian Americans face no obesity-related risk — CDC researchers note that metabolic risk for Asian populations may begin at lower BMI thresholds than current standard categories reflect. The practical implication is that the standard 30 BMI cutoff for obesity may actually undercount the health burden in Asian American communities.
These disparities are not random variation. The 2017–March 2020 NHANES data recorded a 49.9% overall obesity prevalence for non-Hispanic Black adults, 45.6% for Hispanic adults, 41.4% for White adults, and just 16.1% for Asian adults — and the 2022–2024 BRFSS state counts confirm these gaps have not narrowed. The structural drivers are well documented: unequal access to affordable healthy food, fewer safe spaces for physical activity, higher rates of food insecurity, under-resourced healthcare in predominantly Black, Indigenous, and Latino communities, and the documented physiological impact of chronic stress from systemic racism and economic inequity on metabolic health. No intervention strategy that ignores these upstream structural factors will succeed in meaningfully closing these racial and ethnic disparities.
Obesity Rate by State in the US 2026 – Highest and Lowest State Rankings 2024
The CDC’s 2024 BRFSS Adult Obesity Prevalence Maps, published December 3, 2025, provide the most current state-by-state snapshot of adult obesity available anywhere as of 2026.
| State / Territory | 2024 Adult Obesity Rate (BRFSS) | Category |
|---|---|---|
| West Virginia | 41.4% | Highest in the nation |
| Mississippi | 40.4% | 2nd highest |
| Louisiana | 39.2% | 3rd highest |
| Guam (US territory) | ≥ 40% | Highest US territory |
| Puerto Rico | 35–39.9% | Above 35% threshold |
| Virgin Islands | 35–39.9% | Above 35% threshold |
| Colorado | 25.0% | Lowest in the nation |
| Washington, DC | 25.0% | Tied for lowest |
| States with obesity ≥ 40% (2024) | 2 states + Guam | WV, MS, Guam |
| States with obesity 35–39.9% | 17 states + Puerto Rico + Virgin Islands | — |
| States with obesity 30–34.9% | 22 states | — |
| States with obesity 25–29.9% | 8 states + DC | — |
| Midwest regional obesity rate (2024) | 35.9% | Highest region |
| South regional obesity rate (2024) | 34.5% | 2nd highest region |
| Northeast regional obesity rate (2024) | 30.3% | 3rd by region |
| West regional obesity rate (2024) | 30.2% | Lowest region |
Data Sources: CDC 2024 Adult Obesity Prevalence Maps (BRFSS), December 3, 2025; Trust for America’s Health State of Obesity Report 2025, October 16, 2025
The 16.4 percentage point gap between West Virginia (41.4%) and Colorado (25.0%) is not just a statistic — it represents vastly different lived realities, healthcare burdens, and life expectancy outcomes across American states. The Midwest at 35.9% continues to be the hardest-hit region, followed by the South at 34.5%, with the Northeast (30.3%) and West (30.2%) trailing significantly behind. The Trust for America’s Health State of Obesity Report 2025, released October 16, 2025 and based on the December 2025 CDC data, confirmed that between 2023 and 2024, no individual state experienced a statistically significant change in adult obesity rate — meaning the drop from 23 to 19 states at the 35% threshold reflects incremental movements across multiple states rather than a dramatic improvement anywhere. It is, however, the first decrease in this count since the BRFSS dataset began in 2011, and coincides with expanded GLP-1 weight-loss medication access and pandemic-era nutrition assistance program expansions.
The historical baseline makes the current numbers all the more striking: before 2013, not a single US state had an adult obesity prevalence at or above 35%. In 2024, 19 states are at or above that level, and 2 states plus one territory have crossed the 40% mark. Every single US state is now above 25% — a level once considered a serious outlier. The TFAH report specifically warns that recent federal actions — cuts to CDC chronic disease prevention staffing, rollbacks to nutrition assistance programs, and reduced funding for community health initiatives — put even these modest first-time gains directly at risk of reversal before they can consolidate into a genuine sustained trend.
Childhood Obesity Rate in the US 2026 – Children and Adolescent Statistics 2021–2023
The childhood obesity rate in the US has more than tripled since the mid-1970s, and the most current NHANES cycle shows it still rising even as adult rates edged down slightly.
| Age / Group | Obesity Prevalence | Severe Obesity Prevalence |
|---|---|---|
| All youth ages 2–19 — NHANES 2017–March 2020 | 19.7% | 6.1% |
| All youth ages 2–19 — NHANES Aug 2021–Aug 2023 | 21.1% | 7.0% |
| Children ages 2–5 (2017–March 2020) | 12.7% | — |
| Children ages 6–11 (2017–March 2020) | 20.7% | — |
| Adolescents ages 12–19 (2017–March 2020) | 22.2% | — |
| Hispanic children ages 2–19 | 26.2% | — |
| Non-Hispanic Black children ages 2–19 | 24.8% | — |
| Non-Hispanic White children ages 2–19 | 16.6% | — |
| Non-Hispanic Asian children ages 2–19 | 9.0% | — |
| Children with family income ≤ 130% of Federal Poverty Level | 25.8% | — |
| Children with family income 130–350% of FPL | 21.2% | — |
| Children with family income > 350% of FPL | 11.5% | — |
| Total US youth ages 2–19 with obesity (approx.) | ~14.7 million | — |
| Annual medical cost per child with obesity vs. healthy weight | $116 more per year | — |
| Annual medical cost per child with severe obesity vs. healthy weight | $310 more per year | — |
Data Sources: CDC Childhood Obesity Facts (updated December 2024); NCHS Health E-Stat No. 112, Noiman AN et al., February 2025; CDC Adult Obesity Facts
The NCHS Health E-Stat No. 112, published February 2025 — the most recent government-published childhood obesity data available — confirmed that 21.1% of US children and adolescents ages 2–19 had obesity during August 2021–August 2023, including 7.0% with severe obesity. This is an increase from the 19.7% and 6.1% recorded in the prior NHANES cycle. At 21.1%, roughly 1 in 5 American children now has obesity — meaning this is not a fringe health issue but a mainstream reality in US schools, pediatric clinics, and family households. The income gradient is one of the most telling data points in the entire table: 25.8% of children from the lowest-income families (at or below 130% of the Federal Poverty Level) have obesity, compared to just 11.5% of children from the highest-income families — more than double the rate. Food insecurity, inability to afford physical activity programs, less access to safe outdoor spaces, and food desert conditions in lower-income neighborhoods all compound to produce this income-driven disparity in childhood health.
The racial and ethnic disparities in childhood obesity mirror the adult pattern with striking precision. Hispanic children lead at 26.2%, followed by non-Hispanic Black children at 24.8%, non-Hispanic White children at 16.6%, and non-Hispanic Asian children at 9.0%. The CDC’s Childhood Obesity Facts page, updated December 2024, confirms these figures and notes that children with obesity face not just future adult health risks but immediate health consequences — including elevated blood pressure, abnormal glucose tolerance, sleep apnea, bone and joint problems, and significant psychological effects such as anxiety, depression, and peer victimization. The annual healthcare system cost of childhood obesity is $1.3 billion in 2019 dollars, with children with severe obesity costing $310 more per person per year than healthy-weight peers. Every dollar of that cost is a measurable downstream outcome of the structural conditions — income, race, geography, food access — that the tables above quantify.
Adult Obesity Rate by Education Level in the US 2026 – Socioeconomic Disparity Statistics 2024
The 2024 BRFSS education-level data, released by the CDC on December 3, 2025, provides the most current available picture of how education shapes obesity risk across the US adult population.
| Education Level | Adult Obesity Prevalence (BRFSS 2024) |
|---|---|
| No high school diploma or equivalent | 37.6% |
| High school diploma or equivalent | 35.4% |
| Some college, no degree | 35.7% |
| College graduate (bachelor’s degree or higher) | 27.3% |
Data Source: CDC 2024 Adult Obesity Prevalence Maps — Education Level Data (BRFSS), Released December 3, 2025
The BRFSS 2024 education breakdown confirms what multiple prior data cycles have shown: adult obesity prevalence in the US decreases as education level increases, but the meaningful protective effect is concentrated at the college graduate level. Adults without a high school diploma (37.6%), those with a diploma only (35.4%), and those with some college (35.7%) all cluster within roughly 2 percentage points of each other — statistically, these three groups are indistinguishable. College graduates, at 27.3%, are separated from every other group by a gap of 8 to 10 percentage points. The NHANES 2021–2023 data from NCHS Data Brief No. 508 aligns closely: college graduates had obesity at 31.6% compared to 44.6% for adults with a high school diploma or less — confirming the gap holds in both self-reported BRFSS and measured NHANES data.
This is not simply a matter of nutritional education or willpower. The college-graduate threshold is a reliable proxy for a broader package of structural advantages: higher income enabling access to quality food; better health insurance and weight management resources; neighborhoods with full-service grocery stores and safe places to be physically active; lower chronic stress from financial insecurity; and more schedule flexibility to maintain healthy habits. The fact that every non-graduate group sits between 35–38% means that marginal increases in educational attainment — without corresponding improvements in economic conditions, food access, and community infrastructure — do not move the needle on obesity. This is why public health researchers consistently argue that addressing obesity requires structural policy intervention, not just individual health education.
Disclaimer: The data reports published on The Global Files are sourced from publicly available materials considered reliable. While efforts are made to ensure accuracy, no guarantees are provided regarding completeness or reliability. The Global Files is not liable for any errors, omissions, or damages resulting from the use of these reports.