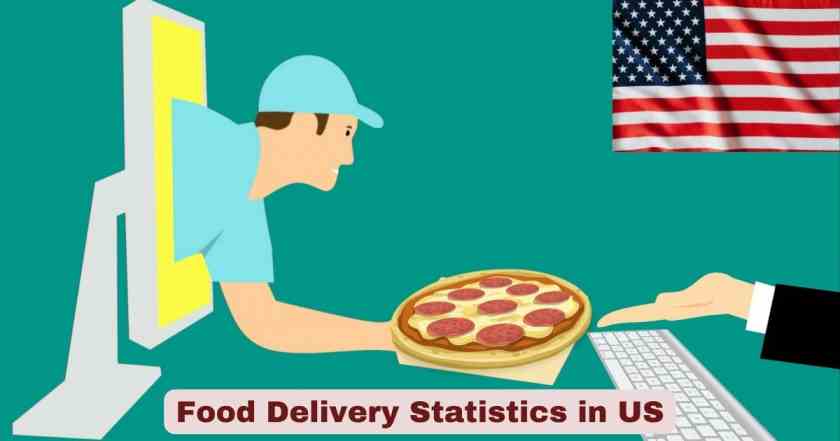
Food Delivery in the US 2026
Food delivery in the US in 2026 is no longer a convenience — it is a deeply embedded behavioral habit that touches virtually every demographic, income bracket, and geography in the country. The industry has grown so comprehensively into the fabric of American daily life that 51% of U.S. consumers now describe ordering delivery or takeout as an “essential part of their lifestyle” — a figure that climbs to 67% among Gen Z and 64% among Millennials. What began as a niche service for busy urban professionals has evolved into a multi-layered ecosystem of platform-to-consumer apps, restaurant direct-ordering systems, ghost kitchens, autonomous delivery robots, and AI-powered logistics that collectively serve tens of millions of orders every single day. Online food ordering has surged 300% faster than dine-in compared to its 2014 baseline, and delivery now accounts for approximately 40% of total U.S. restaurant sales — a structural shift in how the country eats that cannot be reversed.
What makes 2026 such a pivotal moment for the U.S. food delivery industry is the convergence of several forces happening simultaneously. The U.S. online food delivery market — valued between $27.58 billion and $34.9 billion depending on the methodology used — is growing at a CAGR of 8.94% to 10.50% and is projected to nearly double or triple by the mid-2030s. DoorDash has consolidated its dominance with a 65–68% market share, acquiring Deliveroo in 2025 to dramatically expand its international footprint. Uber Eats has doubled down on the Uber One subscription with 46 million members, converting volume into loyalty-driven profitability. Meanwhile, the sector is being reshaped by AI-powered order personalization, autonomous sidewalk robots completing their first 100,000 commercial deliveries, and a restaurant industry that is increasingly building its own direct-ordering infrastructure to escape platform commission fees that run as high as 30% per order. The $1,850 the average American spends on food delivery annually is not a curiosity — it is a core line item in the modern household budget, and the 2026 U.S. food delivery statistics below tell exactly how it got there.
Interesting Facts: Food Delivery in the US 2026
| Fact | Detail |
|---|---|
| Average annual American food delivery spend | $1,850 per person every year |
| Average order frequency | Americans order food delivery once every 6.7 days — about 1.1 times per week |
| Online food ordering growth since 2014 | 300% faster growth than dine-in; now ~40% of total restaurant sales |
| U.S. food delivery revenue growth over 5 years | Up by 204% in the last five years |
| DoorDash U.S. market share (2026) | 65–68% of the entire U.S. food delivery market |
| Uber Eats U.S. market share (2026) | ~23–25% |
| Grubhub U.S. market share | ~12–16% (sold to Wonder Foods at 90% discount on 2021 value) |
| DoorDash orders processed in 2024 | 2.6 billion total orders — 7.12 million orders per day |
| DoorDash Gross Order Value (GOV) in 2024 | $80.2 billion — nearly 10x its 2019 GOV of $8.0 billion |
| Americans spending ~$67 billion annually on DoorDash | Equivalent to roughly $200 per U.S. adult per year on one platform |
| Uber Eats revenue (2025) | $17.1 billion globally — up from $1.1 billion in 2017 |
| Uber Eats active users globally | ~95 million active users across 11,500+ cities in 45 countries |
| DashPass subscribers (DoorDash) | Over 26 million subscribers |
| Uber One members (Uber Eats subscription) | 46 million members — drives ~45% of total Uber Eats bookings |
| 62% of food delivery app users pay for a subscription | Uber Eats subscription adoption leads at 61% |
| Restaurant commission fees charged by platforms | 15–30% per order — creating enormous margin pressure |
| Average delivery time | Approximately 12–35 minutes depending on platform and city |
| Consumers expecting delivery within 40 minutes | 58% of consumers set this as their benchmark expectation |
| DoorDash robot + Serve Robotics pilot milestones | 100,000+ autonomous deliveries completed |
| Market revenue growth from 2021 to 2026 (CAGR) | Industry expected 12% CAGR between 2021 and 2026 |
Source: OysterLink (March 2026), TechRyde (Feb 2026), DemandSage (Dec 2025), AppRhino (Feb 2026), Zippia (Jan 2026), Business of Apps (Jan 2026), DoorDash Delivery Trends Report, National Restaurant Association
The facts above establish the scale and velocity of U.S. food delivery in 2026 with unmistakable clarity. The $1,850 annual spend per person is one of the most frequently cited yet still genuinely startling statistics in the industry: at a frequency of 1.1 orders per week, the average American is spending more on food delivery than on many fixed monthly expenses. The 300% growth in online ordering versus dine-in since 2014 confirms that what was initially framed as a pandemic anomaly was actually the acceleration of a pre-existing structural shift — one that neither economic uncertainty, rising delivery fees, nor tipping fatigue has managed to meaningfully reverse. DoorDash’s GOV growing from $8 billion in 2019 to $80.2 billion in 2024 is one of the most dramatic single-platform financial ascents in U.S. tech history, and it explains why the company’s market cap surged from $39.37 billion to $120.06 billion between 2023 and 2025.
The subscription economy data embedded in these facts is equally telling. When 62% of all food delivery app users are already paying for a premium membership, the industry has effectively converted its most valuable customers into committed, recurring-revenue subscribers — fundamentally altering the competitive logic from customer acquisition to customer retention. DashPass’s 26 million subscribers and Uber One’s 46 million members collectively represent a captive audience of high-frequency, high-spend users who are structurally less likely to switch platforms. The milestone of 100,000+ autonomous deliveries completed jointly by DoorDash and Serve Robotics in pilot programs, and the fact that Serve Robotics was deploying 2,000 AI-driven sidewalk robots nationwide by the end of 2025, signals that the 2026 food delivery industry is entering a phase where technology is starting to reshape its core cost structure from the ground up.
US Food Delivery Market Size 2026 | Revenue, Growth & Forecast Data
| Metric | 2026 Value / Data Point |
|---|---|
| U.S. Online Food Delivery Market Size (Expert Market Research) | USD 27.58 billion (2025 baseline) |
| U.S. Online Food Delivery Market Size (IMARC Group) | USD 34.9 billion (2025 baseline) |
| U.S. Food Delivery Platform Fee Structures Market (Inkwood) | USD 31.22 billion as of 2026 |
| U.S. CAGR (Expert Market Research, 2026–2035) | 10.50% |
| U.S. CAGR (IMARC Group, 2026–2034) | 8.94% |
| Projected U.S. market size by 2034 (IMARC) | USD 75.4 billion |
| Projected U.S. market size by 2035 (Expert Market Research) | USD 74.85 billion |
| Global online food delivery market (2026, TechRyde/Mordor) | USD 284.73 billion |
| Projected global market size by 2031 | USD 468.51 billion (CAGR 10.47%) |
| Global market in 2025 (Statista) | USD 1.40 trillion (includes grocery delivery) |
| Global market projection by 2030 (Statista) | USD 2.02 trillion (CAGR 7.63%) |
| North America’s share of global food delivery market | 31% market share |
| North American food delivery market forecast (2029) | USD 120 billion |
| South region’s U.S. market share dominance | 28.7% of U.S. market — largest regional segment |
| Mobile application share of U.S. food delivery platform | 72.3% of all orders placed via mobile apps |
| U.S. internet penetration (start of 2024) | 97.1% (331.1 million internet users) |
| Food delivery’s share of total restaurant market | Approximately 10.2% of the total food market |
| U.S. food delivery revenue growth (2021–2022) | +20% YoY from $26.5 billion to $31.8 billion |
Source: Expert Market Research (2026), IMARC Group (2026), Inkwood Research (March 2026), TechRyde (Feb 2026), Statista Online Food Delivery Outlook, Deliverect (2025)
The U.S. food delivery market size in 2026 sits at a complex data intersection that deserves careful reading. The wide range between $27.58 billion (Expert Market Research) and $34.9 billion (IMARC Group) reflects methodological differences — EMR uses a tighter definition focused on platform-mediated restaurant delivery, while IMARC’s broader scope includes grocery delivery platforms like Instacart and meal kit services. Both, however, agree on the trajectory: the market will grow to approximately $74–$75 billion by 2034–2035, representing a near-tripling of today’s size driven by a CAGR of 8.94–10.50%. The Inkwood Research figure of $31.22 billion for the U.S. food delivery platform fee structures market as of 2026 offers a third methodology anchor, focused specifically on the revenue generated through commission fees, delivery charges, advertising, and subscriptions that platforms collect rather than the gross merchandise value flowing through them.
The global versus domestic comparison reveals something important about where U.S. food delivery sits in the world picture. The global food delivery market reaching $284.73 billion in 2026 and being projected to hit $468.51 billion by 2031 reflects a pace of international growth — particularly in Southeast Asia, India, and Latin America — that is actually faster than the mature U.S. market. The Statista framework, which packages grocery delivery into the figure and reaches $1.40 trillion globally in 2025, makes China’s position as the world’s top food delivery market unmistakable, with the U.S. ranked second. Domestically, the South region’s 28.7% share reflects a demographic reality — faster population growth, higher urban sprawl, and a dining culture that has enthusiastically adopted delivery platforms across both cities and suburban areas. Mobile apps commanding 72.3% of all order placements in 2026 confirms that the smartphone has fully displaced every other ordering channel as the default interface for American food delivery customers.
DoorDash Statistics 2026 | Market Share, Revenue & Users
| Metric | 2026 / Latest Data |
|---|---|
| DoorDash U.S. market share | 65–68% — dominant market leader |
| DoorDash Gross Order Value (GOV, 2024) | $80.2 billion (up from $8B in 2019 — 10x in 5 years) |
| DoorDash total orders processed (2024) | 2.6 billion orders = 7.12 million/day |
| DoorDash trailing 12-month revenue (Oct 2025) | $11.9 billion |
| DoorDash Q1 2025 net income | $193 million — returned to sustained profitability |
| DoorDash Q1 2025 adjusted EBITDA | $590 million (up from $371M in Q1 2024 — +59%) |
| DoorDash Q1 2025 total orders | 732 million — +18% YoY (vs. 620M in Q1 2024) |
| DoorDash market cap (2025) | $120.06 billion (up 70.68% from $39.37B in 2023) |
| DashPass subscribers | Over 26 million members |
| DashPass adoption as share of U.S. adult population | 12% of U.S. adults (eMarketer 2024) |
| DoorDash active users | Approximately 46.3 million users |
| DoorDash restaurant + grocery partnerships | 590,000 restaurant and grocery partners |
| DoorDash 2024 total Dasher earnings | Over $18 billion paid to ~8 million Dashers |
| Average DoorDash Dasher earnings (2024) | $2,250 average annual earnings per Dasher |
| DoorDash driver average hourly earnings | $18.93/hour including bonuses and tips |
| DoorDash app downloads (2021 peak) | 37 million installs in one year |
| Americans’ total annual spending on DoorDash | Approximately $67 billion |
| DoorDash acquisition of Deliveroo (2025) | $3.9 billion — expanded into Europe, Asia, Middle East |
| DoorDash operating countries | 40+ countries |
| DoorDash market share in San Francisco | 74% — highest city-level dominance on record |
Source: DemandSage (Dec 2025), OysterLink (March 2026), Savings Grove (Dec 2025), Business of Apps (Jan 2026), DoorDash Q1 2025 earnings report
DoorDash’s 2026 statistics represent a platform that has completed its transformation from startup to category-defining infrastructure. The growth of its Gross Order Value from $8 billion in 2019 to $80.2 billion in 2024 — a 10x increase in five years — is arguably the most striking financial metric in all of U.S. tech over that period, built on the back of superior suburban market penetration, DashPass subscription lock-in, and a relentless merchant acquisition strategy. The return to profitability in Q1 2025 — with $193 million in net income and an EBITDA margin of 2.6% of Gross Order Value — finally answered the question that had dogged the company since its IPO: whether the unit economics of food delivery could ever be made to work at scale. The answer in 2026 is a conditional yes — yes, if you have dominant market share, a subscription ecosystem, and advertising revenues layered on top of delivery commissions.
The $3.9 billion acquisition of Deliveroo in 2025 was the single most significant strategic move in U.S. food delivery history, instantly vaulting DoorDash from a primarily North American platform into a global operator with a meaningful footprint in the UK, Ireland, France, Belgium, Italy, Singapore, Hong Kong, and the UAE. Combined with its Wolt operation in Nordic and Eastern European markets, DoorDash now operates across 40+ countries — positioning it to challenge Uber Eats for global leadership beyond the U.S. context where it already dominates. The 26 million DashPass subscribers represent the company’s most durable competitive moat: subscribers order 3x more frequently than non-subscribers and are significantly less price-sensitive, creating a revenue base that is both higher in value and more resistant to competitive switching than the casual user segment.
Uber Eats Statistics 2026 | Revenue, Market Share & Global Reach
| Metric | 2026 / Latest Data |
|---|---|
| Uber Eats U.S. market share | 23–25% — second largest platform |
| Uber Eats global revenue (2025) | $17.1 billion (up from $1.1B in 2017 — 15.5x in 8 years) |
| Uber Eats gross bookings globally (2024) | $74.6 billion |
| Uber Eats Q4 2024 order value | $20.1 billion (narrowly behind DoorDash’s $21.3B) |
| Uber Eats active users globally | ~95 million active users |
| Uber Eats Uber One subscribers | 46 million members — accounts for ~45% of all bookings |
| Uber Eats cities served globally | 11,500+ cities across 45 countries |
| Uber Eats Delivery segment EBITDA growth (Q1 2024) | +83% YoY — from $288M to $528M |
| Uber Eats U.S. market share in Miami | 55% — leads in Miami, trailing DoorDash nationally |
| Uber Eats U.S. market share in San Francisco | 11% — DoorDash holds 74% in the same city |
| Uber Eats commission charged to restaurants | 20–30% per delivery order; 15% for pickup |
| Uber Eats European market share | ~28% — leads in France, Spain |
| Uber Eats revenue growth from 2017 to 2025 | From $1.1 billion → $17.1 billion |
| Uber Eats driver average earnings (national) | $17–27/hour nationally; $30–35/hour in NYC and SF peak hours |
| Uber Eats per-trip earnings vs. DoorDash | $9.58/trip (vs. $7.94 for DoorDash) — 18% more per trip |
| Uber One adoption as share of U.S. adults (eMarketer) | 7% of U.S. adults — vs. DashPass at 12% |
| Uber Eats Postmates acquisition cost (2020) | $2.65 billion |
| Uber Eats majority age demographic | 74.5% of platform users are aged 18–44 |
Source: AppRhino (Feb 2026), Business of Apps (Jan 2026), Statista (March 2024), Savings Grove (Dec 2025), FinanceBuzz (2025), OysterLink (March 2026)
The Uber Eats 2026 data tells the story of a platform that lost the domestic volume war to DoorDash but has found a sustainable path to profitability through global diversification and subscription economics. Its $17.1 billion in revenue in 2025 — up from $1.1 billion in 2017 — represents a 15.5x increase over eight years, a growth rate that would be the envy of virtually any other business. The Delivery segment’s 83% EBITDA improvement in Q1 2024 compared to the same period in 2023 confirmed that Uber Eats has decisively reached the profitability inflection point that Wall Street had been demanding since the pandemic boom faded. The Uber One subscription’s 46 million members driving 45% of all bookings is particularly important: it means that nearly half of everything Uber Eats ships globally is flowing through its highest-value, most-retained customer segment — a structural strength that its gross market share numbers actually understate.
The city-level market data reveals a nuanced competitive picture that national figures obscure. Uber Eats’ 55% share in Miami against DoorDash’s near-monopoly 74% share in San Francisco illustrates that the two platforms are not fighting on the same terrain everywhere — Uber Eats leads in dense coastal metros with large immigrant and international communities familiar with the brand from Uber’s ride-hailing operations, while DoorDash’s suburban-first expansion strategy from its early days gave it unassailable advantages in mid-sized American cities. The $9.58 per-trip earnings for Uber Eats drivers versus DoorDash’s $7.94 — an 18% premium per delivery — reflects the Uber Eats tendency toward longer-distance orders in larger metros, where its ride-hailing network overlap creates operational efficiencies that smaller platforms cannot replicate.
Food Delivery Consumer Behavior Statistics 2026 | Ordering Habits & Preferences
| Metric | 2026 / Latest Data |
|---|---|
| Americans who order food delivery at least once per week | 60% of U.S. consumers |
| U.S. consumers who order delivery at least twice per week | Approximately 60% (subset ordering multiple times) |
| Average food delivery order frequency | 1.1 orders/week = once every 6.7 days |
| 51% of consumers say delivery is “essential to lifestyle” | Gen Z: 67% |
| Preference for home delivery over all other methods | 61% prefer home delivery |
| Consumers preferring to order directly from restaurant | 70% would prefer direct ordering when available |
| Consumers using third-party apps for restaurant discovery | 51% turn to DoorDash or similar apps when deciding what to order |
| Most popular delivery days | Weekends — Friday/Saturday/Sunday dominate all platforms |
| Peak delivery time window | 5–7 PM daily and 6 PM specifically per DoorDash data |
| Breakfast delivery growth in 2024 | +29% in the US — fastest-growing daypart for food delivery |
| Average delivery time expectation | 58% of consumers expect delivery in 40 minutes or less |
| Average actual delivery window (current 2026) | 35–40 minutes on average across platforms |
| Consumers willing to pay extra for faster delivery | 27% willing to pay premium for speed; 23% specifically for same-day |
| Consumers ordering food delivery as “self-care” | 78% of Americans describe food delivery as a self-care activity |
| Consumers placing repeat orders from same restaurant | 47% of U.S. consumers order from the same restaurant at least weekly |
| Alcohol delivery orders growing (US consumers) | 42% of U.S. consumers order alcohol for delivery more often than in 2024 |
| Consumers ordering alcohol delivery for parties | 39% of Americans order alcohol delivery specifically for parties/sports |
| Average order size increase (2025 vs. 2024) | +15% increase in average order size due to group orders and bundling |
| Gen Z and Millennial weekly delivery users | 4 in 10 (40%) use restaurant apps weekly |
| Urban consumers ordering delivery weekly | Nearly 40% of urban residents place weekly orders |
Source: DoorDash Delivery Trends Report (2025), OysterLink (March 2026), TechRyde (Feb 2026), Toast Restaurant Food Delivery Trends, Escoffier Consumer Dining Trends (2025), National Restaurant Association
The consumer behavior data for food delivery in 2026 paints a picture of a market that has moved well past the adoption phase and into full normalization. When 78% of Americans describe ordering food delivery as self-care and 60% are placing at least one order every single week, the category has achieved something rare in consumer behavior: it has become a habitual default rather than a conscious choice. The 47% of consumers who return to the same restaurant weekly for repeat delivery orders speaks to the loyalty dynamics that are emerging within the delivery ecosystem — customers are not randomly browsing platforms but building structured habits around specific restaurants and ordering routines. The 42% of American consumers ordering alcohol delivery more frequently than in 2024 and the +29% growth in breakfast delivery both point to the same underlying trend: delivery is expanding into occasions and dayparts it previously never penetrated.
The gap between consumer preference and consumer behavior in the data is one of the most commercially significant tensions in 2026 U.S. food delivery. 70% of consumers say they would prefer to order directly from the restaurant, but the reality is that 51% of Americans turn to DoorDash or another third-party app first when deciding what to eat — the discovery and convenience functions of the aggregator platforms override stated preference at the moment of decision. This gap is exactly what is fueling the wave of restaurant investment in direct ordering apps and loyalty programs: if restaurants can capture even a fraction of those orders away from third-party platforms charging 15–30% commission, the margin impact is transformative. The +15% increase in average order size in 2025 reflecting group ordering and meal bundling behavior also means that delivery’s total economic contribution to restaurant revenue is growing faster than even the volume data suggests.
Food Delivery Fees, Costs & Tipping Statistics 2026 | Platform Pricing Data
| Metric | 2026 / Latest Data |
|---|---|
| Restaurant commission fees charged by major platforms | 15–30% per order |
| Delivery fee consumers are willing to pay (most common) | $3–$6 — cited by 47% of consumers |
| DoorDash vs. Uber Eats total fee comparison | DoorDash orders average $3.50 less in total fees vs. Uber Eats for identical orders |
| Menu price inflation on delivery apps | Restaurants inflate menu prices 15–25% on platforms to offset commissions |
| Service fee increases in some regions | Consumers in some markets face up to 58% increase in service fees |
| Average U.S. consumer monthly spend on takeout/delivery | $88.50 per month |
| Average U.S. consumer weekly spend on takeout | Approximately $70/week |
| Delivery tip average (online orders) | 15.9% average tip on food delivery orders |
| Takeout tip average | 13.7% average tip on takeout orders |
| National average tip rate across all restaurant scenarios (Q2 2025) | 14.9% — lowest level in recent years |
| Consumers experiencing “tip fatigue” | 65% feel weary of frequent tipping requests |
| Consumers who feel pressured by digital tip screens | 66% feel pressured by app/tablet tip prompts |
| Digital tip amounts vs. cash (research finding) | Digital tips average 15% larger than cash tips |
| U.S. consumers who never tip on takeout/pickup | 19% do not tip for takeout orders |
| Top tipping state for delivery (Delaware) | Average tip of 21.25% |
| Lowest tipping states for delivery | California and Washington — both below 18% average |
| Subscription plan (DashPass/Uber One) monthly fee | $9.99/month — reduces per-order delivery fees significantly |
| Annual savings potential from delivery subscription | Up to $180+ annually for consumers ordering 2–3 times weekly |
Source: OysterLink (March 2026), Savings Grove (Dec 2025), TechRyde (Feb 2026), Escoffier Consumer Dining Survey (2025), Restroworks Tipping Statistics (Oct 2025), Toast Food Delivery Trends 2026
The fee and cost structure of U.S. food delivery in 2026 sits at the center of the industry’s most persistent tension: a platform business model that charges restaurants 15–30% per order while simultaneously charging consumers delivery fees, service fees, and tipping prompts has created a layered cost structure that is generating measurable friction for all parties. The 15–25% menu price inflation that restaurants apply on delivery platforms to recover commission costs means that consumers are effectively paying a hidden surcharge on top of visible delivery and service fees — creating a true total cost of a delivery order that can run 40–50% above the in-restaurant price when all components are added up. Yet 60% of Americans are still ordering weekly, which tells you everything about how deeply the convenience value proposition has been internalized. The fact that DoorDash orders run an average of $3.50 less in total fees than Uber Eats for identical orders is a statistic that will shift millions of consumer decisions in 2026.
The tipping landscape in 2026 has reached a point of genuine cultural conflict. With 65% of consumers experiencing tip fatigue and 66% feeling pressured by digital payment screens, the industry faces a mounting reputational problem around its monetization mechanics — particularly as the national average tip rate has dropped to 14.9%, the lowest level in recent years, signaling a quiet consumer revolt against screen-prompted gratuity. The regional extremes are striking: Delaware’s 21.25% average versus California and Washington’s below-18% averages reflect fundamentally different norms and income contexts. The math for drivers is equally stark: with delivery tips averaging 15.9% and the total tip amount scaling with order size, the bundling of large group orders (reflected in the +15% average order size growth) is materially benefiting driver income even as tip rate percentages slip. The $3–$6 fee tolerance cited by 47% of consumers places a firm ceiling on how aggressively platforms can push delivery fees before they trigger order abandonment.
Food Delivery Gig Worker & Driver Statistics 2026 | Earnings & Workforce Data
| Metric | 2026 / Latest Data |
|---|---|
| DoorDash active Dashers (2024) | Approximately 8 million Dashers |
| Total Dasher earnings paid out by DoorDash (2024) | Over $18 billion across all Dashers |
| Average annual DoorDash Dasher earnings | $2,250 (part-time average across all Dashers) |
| DoorDash average hourly earnings | $18.93/hour (including bonuses and tips) |
| DoorDash average weekly bonus + tip income | $114.84/week in bonuses and tips |
| DoorDash average monthly bonus income | $356.33/month |
| Uber Eats average hourly earnings (national) | $20/hour nationally; $17–27/hour typical range |
| Uber Eats peak city earnings (NYC and SF) | $30–$35/hour during peak hours |
| Full-time delivery driver gross weekly income | $720–$1,000/week (40 hours) |
| Full-time delivery driver net take-home weekly | $500–$750/week after taxes and expenses |
| Full-time delivery driver annual gross | $37,000–$52,000/year |
| Multi-app driver earnings premium | 15–25% higher hourly rate using 2–3 apps simultaneously |
| IRS standard mileage deduction rate for 2026 | 72.5 cents per mile (up 2.5 cents from 2025) |
| Full-time driver annual mileage logged | 20,000–30,000 miles/year for work purposes |
| Potential mileage tax deductions (full-time driver) | $14,000–$21,000 in potential deductions annually at 2026 rate |
| Gig workers missing mileage deductions | 43% of gig workers fail to track all deductible mileage |
| DoorDash driver non-cash tips received | 56% of Dashers receive non-cash tips |
| Drivers preferring time/location flexibility | 64% of Uber Eats drivers strongly agree flexibility is their main benefit |
| Food delivery as share of gig economy workforce | Part of a global gig workforce of approximately 435 million workers |
Source: DemandSage (Dec 2025), ShiftTracker (Feb 2026), Employers.io (March 2026), Savings Grove (Dec 2025), Gridwise (2026), PrimeWay FCU (2025), FinanceBuzz (2024)
The gig worker economy underpinning U.S. food delivery in 2026 is both larger and more economically complex than its surface numbers suggest. The $18 billion paid out to approximately 8 million DoorDash Dashers in 2024 sounds substantial until you divide it to find an average of $2,250 per Dasher annually — a figure that reflects the industry’s reality as a predominantly part-time income supplement rather than a primary livelihood for most participants. The distinction between gross and net is where the real story lives: a full-time driver grossing $720–$1,000/week takes home $500–$750/week after accounting for the 15.3% self-employment tax, vehicle expenses, and fuel costs — reducing what looks like a $40–$50k annual income to something closer to $26,000–$39,000 in actual take-home pay. The IRS mileage deduction rate of 72.5 cents per mile in 2026 (up from 70 cents in 2025) and the potential for $14,000–$21,000 in annual deductions for active drivers are financial tools that are genuinely life-changing for those who track them — which is precisely why the finding that 43% of gig workers miss mileage deductions represents one of the most costly information gaps in the platform economy.
The multi-app strategy — running DoorDash, Uber Eats, and Grubhub simultaneously and cherry-picking the best-paying orders — has become the standard playbook for serious delivery drivers in 2026, delivering a 15–25% hourly earnings premium over single-platform operation. The city-level earnings variance is equally dramatic: New York City and San Francisco consistently produce $30–$35/hour for Uber Eats drivers during peak periods, compared to suburban or rural markets where $15–18/hour before expenses is the norm. The emergence of e-bikes as one of the most profitable delivery vehicles in dense urban markets — with drivers earning $20–$32/hour with near-zero fuel costs — reflects the convergence of urban infrastructure investment, rising gas prices, and platform route optimization that is reshaping what it means to be a food delivery gig worker in 2026. The 64% of drivers who describe schedule flexibility as their primary benefit reinforces why worker classification debates — employee vs. independent contractor — remain so politically charged in this sector.
Food Delivery Technology Trends 2026 | AI, Robots & Ghost Kitchens
| Metric / Trend | 2026 Data Point |
|---|---|
| Global delivery robots market size (2026) | USD 686.1 million |
| Projected global delivery robots market by 2034 | USD 7.62 billion (CAGR 35.10%) |
| North America’s share of global delivery robots market (2025) | 40.10% of global market |
| Autonomous delivery cost savings vs. human drivers | 40–60% reduction in delivery costs |
| DoorDash + Serve Robotics cumulative deliveries (pilot) | 100,000+ autonomous deliveries completed |
| Serve Robotics’ robot deployment target (end of 2025) | 2,000 AI-driven sidewalk robots nationwide |
| Uber Eats robot delivery launch (April 2025) | Serve Robotics + Uber Eats launched in Dallas-Fort Worth metro |
| Global autonomous delivery robot market projection (2034) | USD 6.5 billion |
| Global restaurant robots market (2026) | USD 2 billion |
| Projected restaurant robots market by 2033 | USD 6 billion (CAGR 18%) |
| Meal delivery robot segment share of restaurant robots market | 54.0% of global restaurant robots market in 2026 |
| North America’s share of restaurant robots market (2026) | 36% — leading region globally |
| DoorDash AI-driven menu solutions launch | April 2025 — AI tools to improve restaurant online menus and boost revenue |
| Restaurant technology adoption rate | 95% of restaurant owners say technology improves operational efficiency |
| Ghost kitchen model adoption | Growing share of delivery-only virtual restaurants on all major platforms |
| Hybrid delivery model adoption (US restaurants) | 70% of U.S. restaurants now use in-house drivers for at least some deliveries |
| Independent restaurants relying on third-party platforms | 80% of independent restaurants still use third-party delivery for all or part of operations |
| Direct ordering preference among consumers | 70% prefer ordering directly — driving restaurant investment in own platforms |
Source: Fortune Business Insights (Delivery Robots, 2026), Coherent Market Insights (Jan 2026), Oyelabs (Dec 2025), TechRyde (Feb 2026), IMARC Group (2026), DoorDash press releases (April 2025)
The technology transformation of U.S. food delivery in 2026 is happening along two parallel tracks that are moving at very different speeds. The autonomous delivery robot segment — valued at $686.1 million globally in 2026 and projected to grow at a 35.10% CAGR to reach $7.62 billion by 2034 — is the flashier story, driven by DoorDash and Uber Eats pilot programs that have each crossed 100,000 commercial autonomous deliveries. The economics are compelling: 40–60% cost savings versus human drivers create an overwhelming financial incentive to scale robotic delivery wherever regulatory and infrastructure conditions allow. The Serve Robotics + Uber Eats Dallas-Fort Worth launch in April 2025 and Serve Robotics’ target of 2,000 deployed sidewalk robots by end of 2025 mark the transition from pilot curiosity to early commercial infrastructure. The 54% share of the global restaurant robots market held by meal delivery robots — led by North America with 36% of the global segment — confirms that the U.S. is the world’s most aggressive adopter of autonomous food delivery technology.
The more quietly consequential technology shift in 2026 food delivery is the AI revolution happening inside restaurant operations themselves. DoorDash’s April 2025 launch of AI-driven menu optimization tools — allowing restaurants to automatically improve their online listings, optimize photos, adjust descriptions, and increase conversion rates — is a strategic move that positions DoorDash as an indispensable technology partner for restaurants rather than just a logistics provider. The 95% of restaurant owners who say technology improves operational efficiency creates a market primed for adoption. Meanwhile, the hybrid delivery model — with 70% of U.S. restaurants now using in-house drivers for some deliveries alongside third-party platforms — reflects the industry’s maturing understanding that no single channel is optimal for all orders. As 70% of consumers state a preference for direct restaurant ordering, the financial and technological investment flowing into branded restaurant apps and direct-order platforms is set to meaningfully redirect order flows over the next two to three years, gradually eroding the third-party aggregators’ share of total restaurant delivery revenue even as the overall market expands.
Disclaimer: The data reports published on The Global Files are sourced from publicly available materials considered reliable. While efforts are made to ensure accuracy, no guarantees are provided regarding completeness or reliability. The Global Files is not liable for any errors, omissions, or damages resulting from the use of these reports.